


Optical emission lines Several examples of nuclear disks around
centres of galaxies were found by HST. For example for M87 (the big
elliptical in the Virgo cluster), HST measurements found a Keplerian
rotation curve in the disk with a velocity of 1000km s at a distance
of 19 from the centre11.14. This implies a MDO with
mass
at a distance
of 19 from the centre11.14. This implies a MDO with
mass
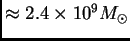 . Similar evidence for a MDO now
exists for other galaxies as well.
. Similar evidence for a MDO now
exists for other galaxies as well.
Maser emission Some AGN have luminous maser sources close to the
centre. Radio observations of these maser lines show that the masers
are in nearly Keplerian rotation, and from the speed one can place
tight constraints on the mass density of the MDO,
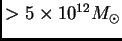 .
.
Reverberation mapping Another elegant way to determine the extent of an AGN is `reverberation mapping'. Many of the emission lines seen from an AGN are due to the light from the central source being reprocessed by the surrounding material. As the central source varies in luminosity, the emission lines follow, but with a time-lag that corresponds to the light-travel time between the central source and the line-emitting gas. So by measuring the time-lag, we can estimate the size of the light-emitting region.